Stock Trend Analysis Report
Prepared for you on Wednesday, March 25, 2026.
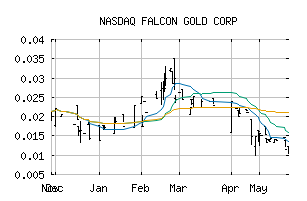
FALCON GOLD CORP (NASDAQ:FGLDF)
Long-Term Downtrend (-90) - FGLDF is in a strong downtrend that is likely to continue. While FGLDF is showing intraday strength, it remains in the confines of a bearish trend. Traders should use caution and set stops.
Is it time to buy, sell, or avoid FGLDF?
MarketClub looks at technical strength and momentum to determine if the timing is right for FGLDF.
Learn more about the Trade Triangles and how we make technical analysis as easy as buy and sell.
|
|||||||||||||||
|
|||||||||||||||
MarketClub’s Trade Triangles for FGLDF
![]() The long-term trend has been DOWN since Mar 13th, 2026 at 0.0100
The long-term trend has been DOWN since Mar 13th, 2026 at 0.0100
![]() The intermediate-term trend has been DOWN since Mar 13th, 2026 at 0.0101
The intermediate-term trend has been DOWN since Mar 13th, 2026 at 0.0101
![]() The short-term trend has been DOWN since Mar 9th, 2026 at 0.0122
The short-term trend has been DOWN since Mar 9th, 2026 at 0.0122
Smart Scan Analysis for FGLDF
Based on our trend formula, FGLDF is rated as a -90 on a scale from -100 (Strong Downtrend) to +100 (Strong Uptrend).
| Open | High | Low | Price | Change |
|---|---|---|---|---|
| 0.0090 | 0.0090 | 0.0083 | 0.0083 | +0.0008 |
| Prev. Close | Volume | Bid | Ask | Time |
| 0.0075 | 110000 | 2026-03-25 10:42:00 |
| 52wk High | 0.027 | 52wk High Date | 2025-04-11 |
| 52wk Low | 0.0023 | 52wk Low Date | 2025-06-17 |
| Average Volume | 110,318 | Shares Outstanding | 8,437 |
| Assets | 506,597M | Liabilities | 2,966,919M |