Stock Trend Analysis Report
Prepared for you on Tuesday, April 14, 2026.
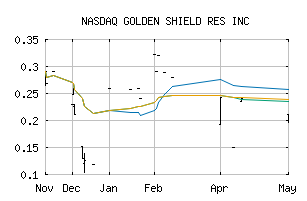
GOLDEN SHIELD RES INC (NASDAQ:GSRFF)
Weak Downtrend (-65) - GSRFF is showing signs of a strengthening downtrend. Monitor GSRFF as it may be building momentum to the downside.
Is it time to buy, sell, or avoid GSRFF?
MarketClub looks at technical strength and momentum to determine if the timing is right for GSRFF.
Learn more about the Trade Triangles and how we make technical analysis as easy as buy and sell.
|
|||||||||||||||
|
|||||||||||||||
MarketClub’s Trade Triangles for GSRFF
![]() The long-term trend has been DOWN since Oct 1st, 2025 at 0.22970
The long-term trend has been DOWN since Oct 1st, 2025 at 0.22970
![]() The intermediate-term trend has been UP since Jan 16th, 2026 at 0.25630
The intermediate-term trend has been UP since Jan 16th, 2026 at 0.25630
![]() The short-term trend has been DOWN since Apr 13th, 2026 at 0.21355
The short-term trend has been DOWN since Apr 13th, 2026 at 0.21355
Smart Scan Analysis for GSRFF
Based on our trend formula, GSRFF is rated as a -65 on a scale from -100 (Strong Downtrend) to +100 (Strong Uptrend).
| Open | High | Low | Price | Change |
|---|---|---|---|---|
| 0.20385 | 0.21500 | 0.20385 | 0.21500 | -0.0157 |
| Prev. Close | Volume | Bid | Ask | Time |
| 0.23070 | 1500 | 2026-04-13 13:25:00 |
| 52wk High | 0.0971 | 52wk High Date | 2024-04-19 |
| 52wk Low | 0.0103 | 52wk Low Date | 2024-12-20 |
| Average Volume | 68,740 | Assets | 1,725,322M |
| Liabilities | 697,987M | P/E Ratio | -0.47060000 |