Stock Trend Analysis Report
Prepared for you on Sunday, May 11, 2025.
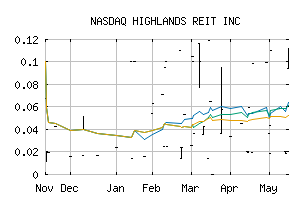
HIGHLANDS REIT INC (NASDAQ:HHDS)
Sidelines Mode (+50) - HHDS is failing to move into a strong trend and is encountering choppy trading conditions. Be cautious and consider taking a sidelines position until HHDS can gain momentum.
Is it time to buy, sell, or avoid HHDS?
MarketClub looks at technical strength and momentum to determine if the timing is right for HHDS.
Learn more about the Trade Triangles and how we make technical analysis as easy as buy and sell.
|
|||||||||||||||
|
|||||||||||||||
MarketClub’s Trade Triangles for HHDS
![]() The long-term trend has been DOWN since Apr 24th, 2025 at 0.01846
The long-term trend has been DOWN since Apr 24th, 2025 at 0.01846
![]() The intermediate-term trend has been UP since Apr 30th, 2025 at 0.09500
The intermediate-term trend has been UP since Apr 30th, 2025 at 0.09500
![]() The short-term trend has been UP since Apr 30th, 2025 at 0.09500
The short-term trend has been UP since Apr 30th, 2025 at 0.09500
Smart Scan Analysis for HHDS
Based on our trend formula, HHDS is rated as a +50 on a scale from -100 (Strong Downtrend) to +100 (Strong Uptrend).
| Open | High | Low | Price | Change |
|---|---|---|---|---|
| 0.090000 | 0.090000 | 0.090000 | 0.090000 | +0.032835 |
| Prev. Close | Volume | Bid | Ask | Time |
| 0.080700 | 3185 | 2025-05-06 09:35:18 |
| 52wk High | 0.15 | 52wk High Date | 2025-03-03 |
| 52wk Low | 0.01 | 52wk Low Date | 2024-08-06 |
| Average Volume | 21,317 | Shares Outstanding | 724,321 |
| Assets | 336,740,000M | Liabilities | 131,787,000M |