Stock Trend Analysis Report
Prepared for you on Saturday, March 14, 2026.
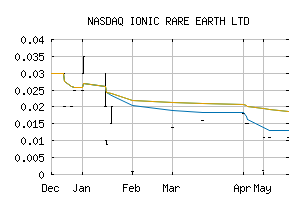
IONIC RARE EARTH LTD (NASDAQ:IXRRF)
Bear Market Rally (-75) - IXRRF is showing some rallying power, but still remains in the confines of a long-term downtrend. Keep an eye on IXRRF as it may be in the beginning of a reversal.
Is it time to buy, sell, or avoid IXRRF?
MarketClub looks at technical strength and momentum to determine if the timing is right for IXRRF.
Learn more about the Trade Triangles and how we make technical analysis as easy as buy and sell.
|
|||||||||||||||
|
|||||||||||||||
MarketClub’s Trade Triangles for IXRRF
![]() The long-term trend has been DOWN since Oct 29th, 2025 at 0.010
The long-term trend has been DOWN since Oct 29th, 2025 at 0.010
![]() The intermediate-term trend has been DOWN since Feb 5th, 2026 at 0.261
The intermediate-term trend has been DOWN since Feb 5th, 2026 at 0.261
![]() The short-term trend has been UP since Feb 5th, 2026 at 0.365
The short-term trend has been UP since Feb 5th, 2026 at 0.365
Smart Scan Analysis for IXRRF
Based on our trend formula, IXRRF is rated as a -75 on a scale from -100 (Strong Downtrend) to +100 (Strong Uptrend).
| Open | High | Low | Price | Change |
|---|---|---|---|---|
| 0.26000 | 0.26000 | 0.26000 | 0.26000 | -0.00992 |
| Prev. Close | Volume | Bid | Ask | Time |
| 0.26000 | 6000 | 2026-03-11 11:19:00 |
| 52wk High | 0.038 | 52wk High Date | 2025-10-15 |
| 52wk Low | 0.0031 | 52wk Low Date | 2024-12-05 |
| Average Volume | 806,560 | Assets | 32,562,342M |
| Liabilities | 2,970,206M |