Stock Trend Analysis Report
Prepared for you on Saturday, October 26, 2024.
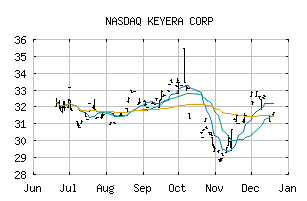
KEYERA CORP (NASDAQ:KEYUF)
Weak Uptrend (+65) - KEYUF is showing signs of weakening momentum to the upside. Monitor KEYUF as it may be in the beginning stages of a reversal.
Is it time to buy, sell, or avoid KEYUF?
MarketClub looks at technical strength and momentum to determine if the timing is right for KEYUF.
Learn more about the Trade Triangles and how we make technical analysis as easy as buy and sell.
|
|||||||||||||||
|
|||||||||||||||
MarketClub’s Trade Triangles for KEYUF
![]() The long-term trend has been UP since Dec 1st, 2023 at 24.9800
The long-term trend has been UP since Dec 1st, 2023 at 24.9800
![]() The intermediate-term trend has been UP since Oct 2nd, 2024 at 31.4373
The intermediate-term trend has been UP since Oct 2nd, 2024 at 31.4373
![]() The short-term trend has been DOWN since Oct 23rd, 2024 at 31.5100
The short-term trend has been DOWN since Oct 23rd, 2024 at 31.5100
Smart Scan Analysis for KEYUF
Based on our trend formula, KEYUF is rated as a +65 on a scale from -100 (Strong Downtrend) to +100 (Strong Uptrend).
| Open | High | Low | Price | Change |
|---|---|---|---|---|
| 30.8115 | 30.8700 | 30.8115 | 30.8700 | -0.0600 |
| Prev. Close | Volume | Bid | Ask | Time |
| 30.8700 | 801 | 2024-10-25 15:22:00 |
| Year High | 29.7827 | Year High Date | 2018-01-17 |
| Year Low | 21.1646 | Year Low Date | 2018-11-28 |
| 52wk High | 32.26 | 52wk High Date | 2024-10-07 |
| 52wk Low | 22.57 | 52wk Low Date | 2024-01-10 |
| Year End Close | 49.405 | Average Volume | 28,750 |
| Shares Outstanding | 153,240 | Assets | 876,901,400M |
| Liabilities | 599,170,100M | P/E Ratio | 28.6389 |
| Volatility | 39.5 |