Stock Trend Analysis Report
Prepared for you on Tuesday, July 1, 2025.
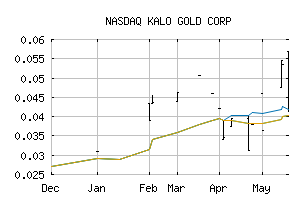
KALO GOLD CORP (NASDAQ:KLGDF)
Countertrend Up (+85) - KLGDF is showing short-term weakness. However, look for the longer-term bullish trend to resume. As always, continue to monitor the trend score and utilize a stop order.
Is it time to buy, sell, or avoid KLGDF?
MarketClub looks at technical strength and momentum to determine if the timing is right for KLGDF.
Learn more about the Trade Triangles and how we make technical analysis as easy as buy and sell.
|
|||||||||||||||
|
|||||||||||||||
MarketClub’s Trade Triangles for KLGDF
![]() The long-term trend has been UP since Nov 6th, 2024 at 0.02760
The long-term trend has been UP since Nov 6th, 2024 at 0.02760
![]() The intermediate-term trend has been UP since Jun 20th, 2025 at 0.05004
The intermediate-term trend has been UP since Jun 20th, 2025 at 0.05004
![]() The short-term trend has been UP since Jun 5th, 2025 at 0.04400
The short-term trend has been UP since Jun 5th, 2025 at 0.04400
Smart Scan Analysis for KLGDF
Based on our trend formula, KLGDF is rated as a +80 on a scale from -100 (Strong Downtrend) to +100 (Strong Uptrend).
| Open | High | Low | Price | Change |
|---|---|---|---|---|
| 0.0554 | 0.0585 | 0.0554 | 0.0585 | +0.0068 |
| Prev. Close | Volume | Bid | Ask | Time |
| 0.0585 | 21500 | 2025-06-26 15:19:00 |
| 52wk High | 0.46 | 52wk High Date | 2021-06-10 |
| 52wk Low | 0.1913 | 52wk Low Date | 2021-07-26 |
| Average Volume | 10,013 |