Stock Trend Analysis Report
Prepared for you on Wednesday, July 30, 2025.
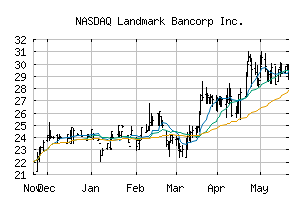
Landmark Bancorp Inc. (NASDAQ:LARK)
Weak Downtrend (-65) - LARK is showing signs of a strengthening downtrend. Monitor LARK as it may be building momentum to the downside.
Is it time to buy, sell, or avoid LARK?
MarketClub looks at technical strength and momentum to determine if the timing is right for LARK.
Learn more about the Trade Triangles and how we make technical analysis as easy as buy and sell.
|
|||||||||||||||
|
|||||||||||||||
MarketClub’s Trade Triangles for LARK
![]() The long-term trend has been UP since Jul 22nd, 2024 at 19.9999
The long-term trend has been UP since Jul 22nd, 2024 at 19.9999
![]() The intermediate-term trend has been DOWN since Jul 29th, 2025 at 25.7350
The intermediate-term trend has been DOWN since Jul 29th, 2025 at 25.7350
![]() The short-term trend has been DOWN since Jul 24th, 2025 at 26.2500
The short-term trend has been DOWN since Jul 24th, 2025 at 26.2500
Smart Scan Analysis for LARK
Based on our trend formula, LARK is rated as a -70 on a scale from -100 (Strong Downtrend) to +100 (Strong Uptrend).
| Open | High | Low | Price | Change |
|---|---|---|---|---|
| 25.28 | 25.32 | 24.79 | 25.13 | -0.15 |
| Prev. Close | Volume | Bid | Ask | Time |
| 25.28 | 9745 | 2025-07-30 15:59:53 |
| Year High | 28.0762 | Year High Date | 2018-08-20 |
| Year Low | 23.2857 | Year Low Date | 2018-11-27 |
| 52wk High | 31.04 | 52wk High Date | 2025-04-23 |
| 52wk Low | 18.342857 | 52wk Low Date | 2024-07-30 |
| Year End Close | 19.89 | Average Volume | 14,287 |
| Shares Outstanding | 5,783 | Short Interest | 1,861 |
| % Institutional | 5.2 | Market Cap | 102M |
| Assets | 157,858,900M | Liabilities | 143,593,800M |
| P/E Ratio | 9.9371 | Volatility | 15.65 |