Stock Trend Analysis Report
Prepared for you on Tuesday, April 14, 2026.
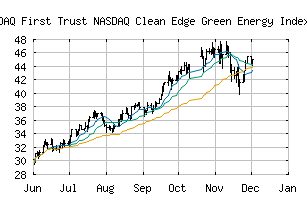
First Trust NASDAQ Clean Edge Green Energy Index Fund (NASDAQ:QCLN)
Bull Market Weakness (+75) - QCLN is showing signs of short-term weakness, but still remains in the confines of a long-term uptrend. Keep an eye on QCLN as it may be in the beginning stages of a reversal.
Is it time to buy, sell, or avoid QCLN?
MarketClub looks at technical strength and momentum to determine if the timing is right for QCLN.
Learn more about the Trade Triangles and how we make technical analysis as easy as buy and sell.
|
|||||||||||||||
|
|||||||||||||||
MarketClub’s Trade Triangles for QCLN
![]() The long-term trend has been DOWN since Mar 30th, 2026 at 43.352
The long-term trend has been DOWN since Mar 30th, 2026 at 43.352
![]() The intermediate-term trend has been UP since Apr 8th, 2026 at 48.870
The intermediate-term trend has been UP since Apr 8th, 2026 at 48.870
![]() The short-term trend has been UP since Apr 1st, 2026 at 46.515
The short-term trend has been UP since Apr 1st, 2026 at 46.515
Smart Scan Analysis for QCLN
Based on our trend formula, QCLN is rated as a +70 on a scale from -100 (Strong Downtrend) to +100 (Strong Uptrend).
| Open | High | Low | Price | Change |
|---|---|---|---|---|
| 49.79 | 50.60 | 49.63 | 50.56 | +0.75 |
| Prev. Close | Volume | Bid | Ask | Time |
| 49.81 | 71067 | 2026-04-13 15:57:33 |
| Year High | 21.73 | Year High Date | 2018-01-22 |
| Year Low | 17.61 | Year Low Date | 2018-10-24 |
| 52wk High | 52.3 | 52wk High Date | 2026-02-25 |
| 52wk Low | 24.99 | 52wk Low Date | 2025-04-21 |
| Year End Close | 9.2901 | Average Volume | 79,559 |
| Shares Outstanding | 13,500 | % Institutional | 68.9 |
| Assets | 149M | Liabilities | 41.9M |
| Beta | 1.44 | Volatility | 28.46 |