Stock Trend Analysis Report
Prepared for you on Tuesday, April 14, 2026.
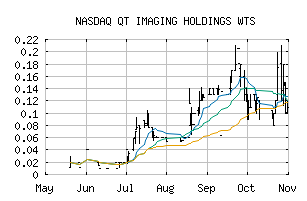
QT IMAGING HOLDINGS WTS (NASDAQ:QTIWW)
Weak Uptrend (+65) - QTIWW is showing signs of weakening momentum to the upside. Monitor QTIWW as it may be in the beginning stages of a reversal.
Is it time to buy, sell, or avoid QTIWW?
MarketClub looks at technical strength and momentum to determine if the timing is right for QTIWW.
Learn more about the Trade Triangles and how we make technical analysis as easy as buy and sell.
|
|||||||||||||||
|
|||||||||||||||
MarketClub’s Trade Triangles for QTIWW
![]() The long-term trend has been UP since Jul 7th, 2025 at 0.0400
The long-term trend has been UP since Jul 7th, 2025 at 0.0400
![]() The intermediate-term trend has been UP since Jan 2nd, 2026 at 0.1211
The intermediate-term trend has been UP since Jan 2nd, 2026 at 0.1211
![]() The short-term trend has been DOWN since Mar 20th, 2026 at 0.2900
The short-term trend has been DOWN since Mar 20th, 2026 at 0.2900
Smart Scan Analysis for QTIWW
Based on our trend formula, QTIWW is rated as a +65 on a scale from -100 (Strong Downtrend) to +100 (Strong Uptrend).
| Open | High | Low | Price | Change |
|---|---|---|---|---|
| 0.300 | 0.300 | 0.300 | 0.300 | +0.024 |
| Prev. Close | Volume | Bid | Ask | Time |
| 0.276 | 10000 | 2026-04-13 15:58:00 |