Stock Trend Analysis Report
Prepared for you on Friday, April 3, 2026.
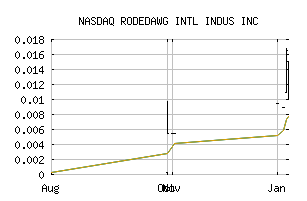
RODEDAWG INTL INDUS INC (NASDAQ:RWGI)
Sidelines Mode (+50) - RWGI is failing to move into a strong trend and is encountering choppy trading conditions. Be cautious and consider taking a sidelines position until RWGI can gain momentum.
Is it time to buy, sell, or avoid RWGI?
MarketClub looks at technical strength and momentum to determine if the timing is right for RWGI.
Learn more about the Trade Triangles and how we make technical analysis as easy as buy and sell.
|
|||||||||||||||
|
|||||||||||||||
MarketClub’s Trade Triangles for RWGI
![]() The long-term trend has been DOWN since Feb 3rd, 2026 at 0.0053
The long-term trend has been DOWN since Feb 3rd, 2026 at 0.0053
![]() The intermediate-term trend has been UP since Apr 2nd, 2026 at 0.0080
The intermediate-term trend has been UP since Apr 2nd, 2026 at 0.0080
![]() The short-term trend has been UP since Apr 2nd, 2026 at 0.0075
The short-term trend has been UP since Apr 2nd, 2026 at 0.0075
Smart Scan Analysis for RWGI
Based on our trend formula, RWGI is rated as a +50 on a scale from -100 (Strong Downtrend) to +100 (Strong Uptrend).
| Open | High | Low | Price | Change |
|---|---|---|---|---|
| 0.00740 | 0.00940 | 0.00740 | 0.00940 | +0.00295 |
| Prev. Close | Volume | Bid | Ask | Time |
| 0.00950 | 138500 | 2026-04-02 13:48:11 |
| Year High | 0.000001 | Year High Date | 2018-07-25 |
| Year Low | 0.000001 | Year Low Date | 2018-07-25 |
| 52wk High | 0.0168 | 52wk High Date | 2026-01-07 |
| 52wk Low | 0.0001 | 52wk Low Date | 2025-06-03 |
| Average Volume | 104,927 | Assets | 1,343M |
| Liabilities | 41,174M | Volatility | 3533.45 |