Stock Trend Analysis Report
Prepared for you on Sunday, May 11, 2025.
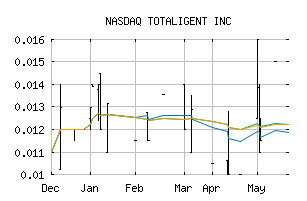
TOTALIGENT INC (NASDAQ:TGNT)
Countertrend Up (+85) - TGNT is showing short-term weakness. However, look for the longer-term bullish trend to resume. As always, continue to monitor the trend score and utilize a stop order.
Is it time to buy, sell, or avoid TGNT?
MarketClub looks at technical strength and momentum to determine if the timing is right for TGNT.
Learn more about the Trade Triangles and how we make technical analysis as easy as buy and sell.
|
|||||||||||||||
|
|||||||||||||||
MarketClub’s Trade Triangles for TGNT
![]() The long-term trend has been UP since Feb 13th, 2025 at 0.018600
The long-term trend has been UP since Feb 13th, 2025 at 0.018600
![]() The intermediate-term trend has been UP since May 9th, 2025 at 0.014000
The intermediate-term trend has been UP since May 9th, 2025 at 0.014000
![]() The short-term trend has been UP since May 9th, 2025 at 0.013675
The short-term trend has been UP since May 9th, 2025 at 0.013675
Smart Scan Analysis for TGNT
Based on our trend formula, TGNT is rated as a +80 on a scale from -100 (Strong Downtrend) to +100 (Strong Uptrend).
| Open | High | Low | Price | Change |
|---|---|---|---|---|
| 0.02170 | 0.02785 | 0.02170 | 0.02570 | +0.00350 |
| Prev. Close | Volume | Bid | Ask | Time |
| 0.03000 | 109500 | 2025-05-09 15:20:51 |