Stock Trend Analysis Report
Prepared for you on Wednesday, March 25, 2026.
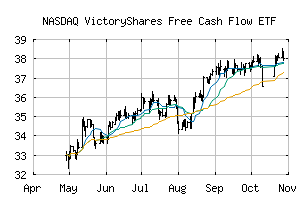
VictoryShares Free Cash Flow ETF (NASDAQ:VFLO)
Sidelines Mode (+55) - VFLO is moving in a sideways pattern and is unable to gain momentum in either direction. Beware of choppy movement and consider a sidelines position until a stronger trend is identified.
Is it time to buy, sell, or avoid VFLO?
MarketClub looks at technical strength and momentum to determine if the timing is right for VFLO.
Learn more about the Trade Triangles and how we make technical analysis as easy as buy and sell.
|
|||||||||||||||
|
|||||||||||||||
MarketClub’s Trade Triangles for VFLO
![]() The long-term trend has been UP since Jun 17th, 2025 at 35.535
The long-term trend has been UP since Jun 17th, 2025 at 35.535
![]() The intermediate-term trend has been DOWN since Mar 9th, 2026 at 39.402
The intermediate-term trend has been DOWN since Mar 9th, 2026 at 39.402
![]() The short-term trend has been UP since Mar 23rd, 2026 at 39.890
The short-term trend has been UP since Mar 23rd, 2026 at 39.890
Smart Scan Analysis for VFLO
Based on our trend formula, VFLO is rated as a +55 on a scale from -100 (Strong Downtrend) to +100 (Strong Uptrend).
| Open | High | Low | Price | Change |
|---|---|---|---|---|
| 39.820 | 40.070 | 39.315 | 39.775 | +0.245 |
| Prev. Close | Volume | Bid | Ask | Time |
| 39.530 | 674260 | 2026-03-25 15:59:41 |
| 52wk High | 40.745 | 52wk High Date | 2026-03-05 |
| 52wk Low | 29.48 | 52wk Low Date | 2025-04-09 |
| Average Volume | 1,115,207 |