Stock Trend Analysis Report
Prepared for you on Tuesday, April 21, 2026.
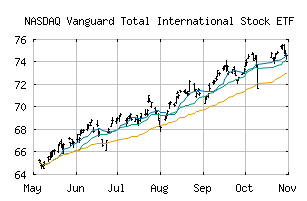
Vanguard Total International Stock ETF (NASDAQ:VXUS)
Bull Market Weakness (+75) - VXUS is showing signs of short-term weakness, but still remains in the confines of a long-term uptrend. Keep an eye on VXUS as it may be in the beginning stages of a reversal.
Is it time to buy, sell, or avoid VXUS?
MarketClub looks at technical strength and momentum to determine if the timing is right for VXUS.
Learn more about the Trade Triangles and how we make technical analysis as easy as buy and sell.
|
|||||||||||||||
|
|||||||||||||||
MarketClub’s Trade Triangles for VXUS
![]() The long-term trend has been DOWN since Mar 20th, 2026 at 74.357
The long-term trend has been DOWN since Mar 20th, 2026 at 74.357
![]() The intermediate-term trend has been UP since Apr 8th, 2026 at 79.040
The intermediate-term trend has been UP since Apr 8th, 2026 at 79.040
![]() The short-term trend has been UP since Mar 31st, 2026 at 76.560
The short-term trend has been UP since Mar 31st, 2026 at 76.560
Smart Scan Analysis for VXUS
Based on our trend formula, VXUS is rated as a +70 on a scale from -100 (Strong Downtrend) to +100 (Strong Uptrend).
| Open | High | Low | Price | Change |
|---|---|---|---|---|
| 80.640 | 81.925 | 80.595 | 81.875 | +0.605 |
| Prev. Close | Volume | Bid | Ask | Time |
| 81.270 | 5367473 | 2026-04-13 15:59:42 |
| Year High | 61.17 | Year High Date | 2018-01-26 |
| Year Low | 47.93 | Year Low Date | 2018-10-29 |
| 52wk High | 84.28 | 52wk High Date | 2026-02-25 |
| 52wk Low | 58.8 | 52wk Low Date | 2025-04-11 |
| Year End Close | 47.07 | Average Volume | 7,629,006 |
| Shares Outstanding | 27,222 | Assets | 860,912M |
| Volatility | 18.85 |