Stock Trend Analysis Report
Prepared for you on Friday, February 6, 2026.
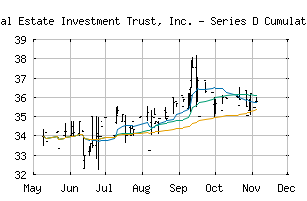
Wheeler Real Estate Investment Trust, Inc. - Series D Cumulative Preferred Stock (NASDAQ:WHLRD)
Sidelines Mode (+55) - WHLRD is moving in a sideways pattern and is unable to gain momentum in either direction. Beware of choppy movement and consider a sidelines position until a stronger trend is identified.
Is it time to buy, sell, or avoid WHLRD?
MarketClub looks at technical strength and momentum to determine if the timing is right for WHLRD.
Learn more about the Trade Triangles and how we make technical analysis as easy as buy and sell.
|
|||||||||||||||
|
|||||||||||||||
MarketClub’s Trade Triangles for WHLRD
![]() The long-term trend has been UP since Feb 6th, 2024 at 15.295
The long-term trend has been UP since Feb 6th, 2024 at 15.295
![]() The intermediate-term trend has been DOWN since Jan 23rd, 2026 at 38.000
The intermediate-term trend has been DOWN since Jan 23rd, 2026 at 38.000
![]() The short-term trend has been UP since Feb 6th, 2026 at 38.970
The short-term trend has been UP since Feb 6th, 2026 at 38.970
Smart Scan Analysis for WHLRD
Based on our trend formula, WHLRD is rated as a +55 on a scale from -100 (Strong Downtrend) to +100 (Strong Uptrend).
| Open | High | Low | Price | Change |
|---|---|---|---|---|
| 37.60 | 39.99 | 39.35 | 39.45 | +0.99 |
| Prev. Close | Volume | Bid | Ask | Time |
| 38.46 | 15803 | 2026-02-06 12:32:00 |
| Year High | 22 | Year High Date | 2018-08-28 |
| Year Low | 14.66 | Year Low Date | 2018-03-28 |
| 52wk High | 42 | 52wk High Date | 2025-12-05 |
| 52wk Low | 28.7 | 52wk Low Date | 2025-04-09 |
| Average Volume | 1,558 | Market Cap | 48M |
| Assets | 625,174,000M | Liabilities | 564,586,000M |
| Volatility | 28.25 |