Stock Trend Analysis Report
Prepared for you on Wednesday, November 20, 2024.
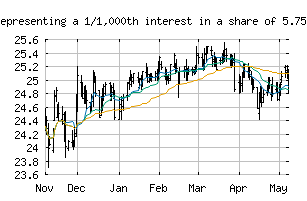
Duke Energy Corporation Depositary Shares, each representing a 1/1,000th interest in a share of 5.75% Series A Cumulative Redeemable Perpetual Preferred Stock (NYSE:DUK.PR.A)
Weak Downtrend (-65) - DUK.PR.A is showing signs of a strengthening downtrend. Monitor DUK.PR.A as it may be building momentum to the downside.
Is it time to buy, sell, or avoid DUK.PR.A?
MarketClub looks at technical strength and momentum to determine if the timing is right for DUK.PR.A.
Learn more about the Trade Triangles and how we make technical analysis as easy as buy and sell.
|
|||||||||||||||
|
|||||||||||||||
MarketClub’s Trade Triangles for DUK.PR.A
![]() The long-term trend has been UP since Aug 8th, 2024 at 25.3500
The long-term trend has been UP since Aug 8th, 2024 at 25.3500
![]() The intermediate-term trend has been DOWN since Nov 15th, 2024 at 25.0867
The intermediate-term trend has been DOWN since Nov 15th, 2024 at 25.0867
![]() The short-term trend has been DOWN since Nov 12th, 2024 at 25.2000
The short-term trend has been DOWN since Nov 12th, 2024 at 25.2000
Smart Scan Analysis for DUK.PR.A
Based on our trend formula, DUK.PR.A is rated as a -70 on a scale from -100 (Strong Downtrend) to +100 (Strong Uptrend).
| Open | High | Low | Price | Change |
|---|---|---|---|---|
| 25.0100 | 25.0400 | 24.8100 | 24.8899 | -0.0801 |
| Prev. Close | Volume | Bid | Ask | Time |
| 24.9600 | 108503 | 2024-11-19 15:58:03 |
| 52wk High | 25.66 | 52wk High Date | 2024-09-16 |
| 52wk Low | 23.845 | 52wk Low Date | 2023-11-22 |
| Average Volume | 52,037 | Assets | 183,566,000M |
| Liabilities | 134,433,000M |