Stock Trend Analysis Report
Prepared for you on Monday, July 7, 2025.
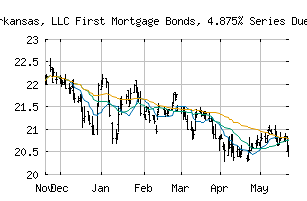
Entergy Arkansas, LLC First Mortgage Bonds, 4.875% Series Due September 1, 2066 (NYSE:EAI)
Bear Market Rally (-75) - EAI is showing some rallying power, but still remains in the confines of a long-term downtrend. Keep an eye on EAI as it may be in the beginning of a reversal.
Is it time to buy, sell, or avoid EAI?
MarketClub looks at technical strength and momentum to determine if the timing is right for EAI.
Learn more about the Trade Triangles and how we make technical analysis as easy as buy and sell.
|
|||||||||||||||
|
|||||||||||||||
MarketClub’s Trade Triangles for EAI
![]() The long-term trend has been DOWN since Dec 12th, 2024 at 21.7975
The long-term trend has been DOWN since Dec 12th, 2024 at 21.7975
![]() The intermediate-term trend has been DOWN since May 21st, 2025 at 20.5886
The intermediate-term trend has been DOWN since May 21st, 2025 at 20.5886
![]() The short-term trend has been DOWN since Jun 30th, 2025 at 20.4000
The short-term trend has been DOWN since Jun 30th, 2025 at 20.4000
Smart Scan Analysis for EAI
Based on our trend formula, EAI is rated as a -80 on a scale from -100 (Strong Downtrend) to +100 (Strong Uptrend).
| Open | High | Low | Price | Change |
|---|---|---|---|---|
| 20.55 | 20.61 | 20.40 | 20.55 | +0.02 |
| Prev. Close | Volume | Bid | Ask | Time |
| 20.57 | 14583 | 2025-07-03 12:59:37 |
| Year High | 25.14 | Year High Date | 2018-01-08 |
| Year Low | 21.56 | Year Low Date | 2018-10-29 |
| 52wk High | 23.58 | 52wk High Date | 2024-10-16 |
| 52wk Low | 20.05 | 52wk Low Date | 2025-06-30 |
| Average Volume | 22,754 | Assets | 150,920,870M |
| Liabilities | 105,555,360M | Volatility | 12.88 |