Stock Trend Analysis Report
Prepared for you on Wednesday, March 25, 2026.
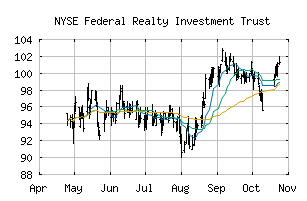
Federal Realty Investment Trust (NYSE:FRT)
Weak Downtrend (-65) - FRT is showing signs of a strengthening downtrend. Monitor FRT as it may be building momentum to the downside.
Is it time to buy, sell, or avoid FRT?
MarketClub looks at technical strength and momentum to determine if the timing is right for FRT.
Learn more about the Trade Triangles and how we make technical analysis as easy as buy and sell.
|
|||||||||||||||
|
|||||||||||||||
MarketClub’s Trade Triangles for FRT
![]() The long-term trend has been UP since Aug 22nd, 2025 at 98.74
The long-term trend has been UP since Aug 22nd, 2025 at 98.74
![]() The intermediate-term trend has been DOWN since Mar 9th, 2026 at 104.21
The intermediate-term trend has been DOWN since Mar 9th, 2026 at 104.21
![]() The short-term trend has been DOWN since Mar 20th, 2026 at 105.20
The short-term trend has been DOWN since Mar 20th, 2026 at 105.20
Smart Scan Analysis for FRT
Based on our trend formula, FRT is rated as a -70 on a scale from -100 (Strong Downtrend) to +100 (Strong Uptrend).
| Open | High | Low | Price | Change |
|---|---|---|---|---|
| 103.3800 | 103.7800 | 102.2401 | 103.2325 | +0.1125 |
| Prev. Close | Volume | Bid | Ask | Time |
| 103.1200 | 543544 | 2026-03-25 15:59:44 |
| Year High | 134.2 | Year High Date | 2018-01-03 |
| Year Low | 106.41 | Year Low Date | 2018-02-14 |
| 52wk High | 110.885 | 52wk High Date | 2026-03-03 |
| 52wk Low | 80.65 | 52wk Low Date | 2025-04-09 |
| Year End Close | 104.02 | Average Volume | 702,533 |
| Shares Outstanding | 86,276 | Short Interest | 1,882,158 |
| % Institutional | 97.3 | Assets | 913,046,000M |
| Liabilities | 588,172,900M | P/E Ratio | 22.0342 |
| Beta | 0.6 | Volatility | 17.14 |