Stock Trend Analysis Report
Prepared for you on Thursday, February 5, 2026.
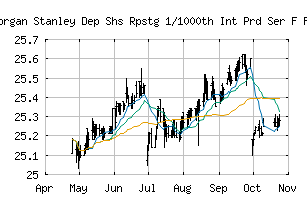
Morgan Stanley Dep Shs Rpstg 1/1000th Int Prd Ser F Fxd to Flag (NYSE:MS.PR.F)
Weak Uptrend (+65) - MS.PR.F is showing signs of weakening momentum to the upside. Monitor MS.PR.F as it may be in the beginning stages of a reversal.
Is it time to buy, sell, or avoid MS.PR.F?
MarketClub looks at technical strength and momentum to determine if the timing is right for MS.PR.F.
Learn more about the Trade Triangles and how we make technical analysis as easy as buy and sell.
|
|||||||||||||||
|
|||||||||||||||
MarketClub’s Trade Triangles for MS.PR.F
![]() The long-term trend has been UP since Sep 10th, 2025 at 25.55
The long-term trend has been UP since Sep 10th, 2025 at 25.55
![]() The intermediate-term trend has been DOWN since Dec 31st, 2025 at 25.35
The intermediate-term trend has been DOWN since Dec 31st, 2025 at 25.35
![]() The short-term trend has been UP since Jan 6th, 2026 at 25.23
The short-term trend has been UP since Jan 6th, 2026 at 25.23
Smart Scan Analysis for MS.PR.F
Based on our trend formula, MS.PR.F is rated as a +65 on a scale from -100 (Strong Downtrend) to +100 (Strong Uptrend).
| Open | High | Low | Price | Change |
|---|---|---|---|---|
| 25.2400 | 25.3000 | 25.2400 | 25.2563 | +0.0163 |
| Prev. Close | Volume | Bid | Ask | Time |
| 25.2563 | 38361 | 2026-02-04 15:56:45 |
| Year High | 28.59 | Year High Date | 2018-01-11 |
| Year Low | 26.16 | Year Low Date | 2018-11-29 |
| 52wk High | 25.63 | 52wk High Date | 2025-03-07 |
| 52wk Low | 24.87 | 52wk Low Date | 2025-04-11 |
| Average Volume | 44,150 | Volatility | 5.7 |