Stock Trend Analysis Report
Prepared for you on Monday, March 16, 2026.
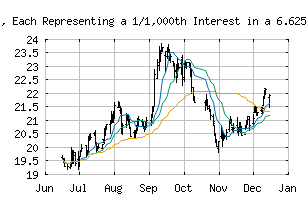
Telephone and Data Systems, Inc. Depositary Shares, Each Representing a 1/1,000th Interest in a 6.625% Series UU Cumulative Redeemable Perpetual Preferred Stock (NYSE:TDS.PR.U)
Weak Downtrend (-65) - TDS.PR.U is showing signs of a strengthening downtrend. Monitor TDS.PR.U as it may be building momentum to the downside.
Is it time to buy, sell, or avoid TDS.PR.U?
MarketClub looks at technical strength and momentum to determine if the timing is right for TDS.PR.U.
Learn more about the Trade Triangles and how we make technical analysis as easy as buy and sell.
|
|||||||||||||||
|
|||||||||||||||
MarketClub’s Trade Triangles for TDS.PR.U
![]() The long-term trend has been UP since Aug 1st, 2025 at 21.37
The long-term trend has been UP since Aug 1st, 2025 at 21.37
![]() The intermediate-term trend has been DOWN since Feb 24th, 2026 at 21.95
The intermediate-term trend has been DOWN since Feb 24th, 2026 at 21.95
![]() The short-term trend has been DOWN since Mar 9th, 2026 at 22.22
The short-term trend has been DOWN since Mar 9th, 2026 at 22.22
Smart Scan Analysis for TDS.PR.U
Based on our trend formula, TDS.PR.U is rated as a -70 on a scale from -100 (Strong Downtrend) to +100 (Strong Uptrend).
| Open | High | Low | Price | Change |
|---|---|---|---|---|
| 22.09 | 22.15 | 21.96 | 21.97 | -0.10 |
| Prev. Close | Volume | Bid | Ask | Time |
| 21.56 | 8608 | 2026-03-13 15:59:56 |
| 52wk High | 23.87 | 52wk High Date | 2025-09-11 |
| 52wk Low | 18.71 | 52wk Low Date | 2025-04-16 |
| Average Volume | 24,739 | Assets | 839,830,300M |
| Liabilities | 359,669,600M |