Stock Trend Analysis Report
Prepared for you on Sunday, July 6, 2025.
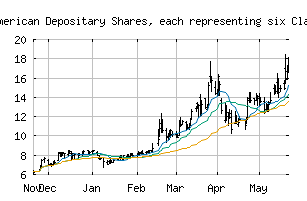
X Financial American Depositary Shares, each representing six Class A Ordinary Shares (NYSE:XYF)
Weak Uptrend (+65) - XYF is showing signs of weakening momentum to the upside. Monitor XYF as it may be in the beginning stages of a reversal.
Is it time to buy, sell, or avoid XYF?
MarketClub looks at technical strength and momentum to determine if the timing is right for XYF.
Learn more about the Trade Triangles and how we make technical analysis as easy as buy and sell.
|
|||||||||||||||
|
|||||||||||||||
MarketClub’s Trade Triangles for XYF
![]() The long-term trend has been UP since Jul 15th, 2024 at 4.45
The long-term trend has been UP since Jul 15th, 2024 at 4.45
![]() The intermediate-term trend has been DOWN since Jun 23rd, 2025 at 16.56
The intermediate-term trend has been DOWN since Jun 23rd, 2025 at 16.56
![]() The short-term trend has been UP since Jun 30th, 2025 at 17.56
The short-term trend has been UP since Jun 30th, 2025 at 17.56
Smart Scan Analysis for XYF
Based on our trend formula, XYF is rated as a +65 on a scale from -100 (Strong Downtrend) to +100 (Strong Uptrend).
| Open | High | Low | Price | Change |
|---|---|---|---|---|
| 18.95 | 19.55 | 18.60 | 18.94 | +0.07 |
| Prev. Close | Volume | Bid | Ask | Time |
| 19.01 | 211702 | 2025-07-03 12:59:29 |
| Year High | 20.3 | Year High Date | 2018-09-19 |
| Year Low | 6.69 | Year Low Date | 2018-11-12 |
| 52wk High | 19.8 | 52wk High Date | 2025-06-09 |
| 52wk Low | 3.78 | 52wk Low Date | 2024-08-05 |
| Average Volume | 287,059 | Market Cap | 475M |
| Assets | 120,930,050M | Liabilities | 465,757,800M |
| P/E Ratio | 23.7328 | Volatility | 56.27 |