Stock Trend Analysis Report
Prepared for you on Wednesday, April 8, 2026.
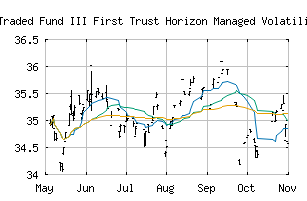
First Trust Horizon Managed Volatility Developed International ETF (PACF:HDMV)
Countertrend Up (+85) - HDMV is showing short-term weakness. However, look for the longer-term bullish trend to resume. As always, continue to monitor the trend score and utilize a stop order.
Is it time to buy, sell, or avoid HDMV?
MarketClub looks at technical strength and momentum to determine if the timing is right for HDMV.
Learn more about the Trade Triangles and how we make technical analysis as easy as buy and sell.
|
|||||||||||||||
|
|||||||||||||||
MarketClub’s Trade Triangles for HDMV
![]() The long-term trend has been UP since Jan 5th, 2026 at 35.610
The long-term trend has been UP since Jan 5th, 2026 at 35.610
![]() The intermediate-term trend has been UP since Apr 1st, 2026 at 37.030
The intermediate-term trend has been UP since Apr 1st, 2026 at 37.030
![]() The short-term trend has been UP since Mar 31st, 2026 at 36.175
The short-term trend has been UP since Mar 31st, 2026 at 36.175
Smart Scan Analysis for HDMV
Based on our trend formula, HDMV is rated as a +80 on a scale from -100 (Strong Downtrend) to +100 (Strong Uptrend).
| Open | High | Low | Price | Change |
|---|---|---|---|---|
| 37.1400 | 37.1800 | 37.1800 | 37.1800 | -0.1251 |
| Prev. Close | Volume | Bid | Ask | Time |
| 37.3327 | 374 | 2026-04-07 14:06:11 |
| Year High | 36.34 | Year High Date | 2018-01-26 |
| Year Low | 30.84 | Year Low Date | 2018-10-26 |
| 52wk High | 39.14 | 52wk High Date | 2026-02-26 |
| 52wk Low | 29.9827 | 52wk Low Date | 2025-04-08 |
| Average Volume | 850 | Volatility | 12.04 |