Stock Trend Analysis Report
Prepared for you on Wednesday, March 25, 2026.
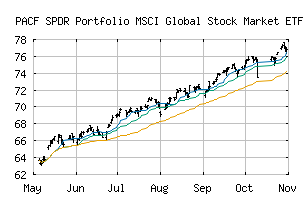
State Street SPDR Portfolio MSCI Global Stock Market ETF (PACF:SPGM)
Countertrend Down (-85) - SPGM is showing short-term strength. However, look for the longer-term bearish trend to resume. As always, continue to monitor the trend score and set stops.
Is it time to buy, sell, or avoid SPGM?
MarketClub looks at technical strength and momentum to determine if the timing is right for SPGM.
Learn more about the Trade Triangles and how we make technical analysis as easy as buy and sell.
|
|||||||||||||||
|
|||||||||||||||
MarketClub’s Trade Triangles for SPGM
![]() The long-term trend has been DOWN since Mar 19th, 2026 at 75.2600
The long-term trend has been DOWN since Mar 19th, 2026 at 75.2600
![]() The intermediate-term trend has been DOWN since Mar 3rd, 2026 at 78.7710
The intermediate-term trend has been DOWN since Mar 3rd, 2026 at 78.7710
![]() The short-term trend has been UP since Mar 25th, 2026 at 76.5112
The short-term trend has been UP since Mar 25th, 2026 at 76.5112
Smart Scan Analysis for SPGM
Based on our trend formula, SPGM is rated as a -85 on a scale from -100 (Strong Downtrend) to +100 (Strong Uptrend).
| Open | High | Low | Price | Change |
|---|---|---|---|---|
| 76.21 | 76.64 | 75.85 | 76.14 | +0.62 |
| Prev. Close | Volume | Bid | Ask | Time |
| 75.52 | 136829 | 2026-03-25 15:59:26 |
| 52wk High | 81.23 | 52wk High Date | 2026-02-26 |
| 52wk Low | 54.21 | 52wk Low Date | 2025-04-07 |
| Average Volume | 385,705 |