Stock Trend Analysis Report
Prepared for you on Tuesday, April 14, 2026.
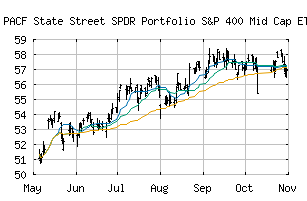
State Street SPDR Portfolio S&P 400 Mid Cap ETF (PACF:SPMD)
Crossroads (+60) - SPMD is struggling to move into a solid trend. Beware of choppy markets and consider a sidelines position until a stronger trend is identified.
Is it time to buy, sell, or avoid SPMD?
MarketClub looks at technical strength and momentum to determine if the timing is right for SPMD.
Learn more about the Trade Triangles and how we make technical analysis as easy as buy and sell.
|
|||||||||||||||
|
|||||||||||||||
MarketClub’s Trade Triangles for SPMD
![]() The long-term trend has been DOWN since Mar 20th, 2026 at 57.54
The long-term trend has been DOWN since Mar 20th, 2026 at 57.54
![]() The intermediate-term trend has been UP since Apr 7th, 2026 at 60.31
The intermediate-term trend has been UP since Apr 7th, 2026 at 60.31
![]() The short-term trend has been UP since Apr 14th, 2026 at 62.47
The short-term trend has been UP since Apr 14th, 2026 at 62.47
Smart Scan Analysis for SPMD
Based on our trend formula, SPMD is rated as a +60 on a scale from -100 (Strong Downtrend) to +100 (Strong Uptrend).
| Open | High | Low | Price | Change |
|---|---|---|---|---|
| 62.630 | 62.895 | 62.320 | 62.730 | +0.300 |
| Prev. Close | Volume | Bid | Ask | Time |
| 62.430 | 1089692 | 2026-04-14 15:59:43 |
| Year High | 37.08 | Year High Date | 2018-08-27 |
| Year Low | 31.17 | Year Low Date | 2018-02-09 |
| 52wk High | 63.67 | 52wk High Date | 2026-02-20 |
| 52wk Low | 46.5308 | 52wk Low Date | 2025-04-21 |
| Average Volume | 3,761,494 | Shares Outstanding | 3,750 |
| Volatility | 20.36 |