Stock Trend Analysis Report
Prepared for you on Friday, July 4, 2025.
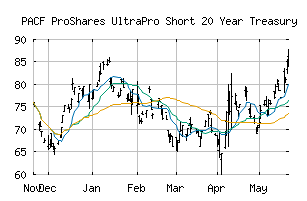
ProShares UltraPro Short 20 Year Treasury (PACF:TTT)
Sidelines Mode (+55) - TTT is moving in a sideways pattern and is unable to gain momentum in either direction. Beware of choppy movement and consider a sidelines position until a stronger trend is identified.
Is it time to buy, sell, or avoid TTT?
MarketClub looks at technical strength and momentum to determine if the timing is right for TTT.
Learn more about the Trade Triangles and how we make technical analysis as easy as buy and sell.
|
|||||||||||||||
|
|||||||||||||||
MarketClub’s Trade Triangles for TTT
![]() The long-term trend has been UP since May 19th, 2025 at 82.4999
The long-term trend has been UP since May 19th, 2025 at 82.4999
![]() The intermediate-term trend has been DOWN since Jun 4th, 2025 at 76.9599
The intermediate-term trend has been DOWN since Jun 4th, 2025 at 76.9599
![]() The short-term trend has been UP since Jul 3rd, 2025 at 74.5000
The short-term trend has been UP since Jul 3rd, 2025 at 74.5000
Smart Scan Analysis for TTT
Based on our trend formula, TTT is rated as a +55 on a scale from -100 (Strong Downtrend) to +100 (Strong Uptrend).
| Open | High | Low | Price | Change |
|---|---|---|---|---|
| 74.6700 | 74.9071 | 74.9071 | 74.9071 | +1.3571 |
| Prev. Close | Volume | Bid | Ask | Time |
| 75.0590 | 137 | 2025-07-03 10:09:13 |
| Year High | 33.06 | Year High Date | 2018-11-02 |
| Year Low | 24.58 | Year Low Date | 2018-01-02 |
| 52wk High | 87.705 | 52wk High Date | 2025-05-22 |
| 52wk Low | 54.12 | 52wk Low Date | 2024-09-17 |
| Average Volume | 4,559 | Shares Outstanding | 6,894 |
| Volatility | 20.98 |