Stock Trend Analysis Report
Prepared for you on Thursday, July 3, 2025.
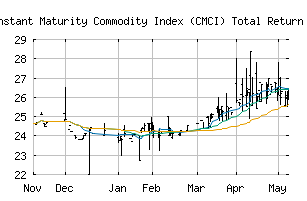
ETRACS UBS Bloomberg Constant Maturity Commodity Index (CMCI) Total Return ETN Series B due April 5, 2038 (PACF:UCIB)
Crossroads (-60) - UCIB is struggling to move into a solid trend. Beware of choppy markets and consider a sidelines position until a stronger trend is identified.
Is it time to buy, sell, or avoid UCIB?
MarketClub looks at technical strength and momentum to determine if the timing is right for UCIB.
Learn more about the Trade Triangles and how we make technical analysis as easy as buy and sell.
|
|||||||||||||||
|
|||||||||||||||
MarketClub’s Trade Triangles for UCIB
![]() The long-term trend has been UP since Jun 20th, 2025 at 27.30
The long-term trend has been UP since Jun 20th, 2025 at 27.30
![]() The intermediate-term trend has been DOWN since Jun 25th, 2025 at 25.79
The intermediate-term trend has been DOWN since Jun 25th, 2025 at 25.79
![]() The short-term trend has been DOWN since Jun 20th, 2025 at 26.38
The short-term trend has been DOWN since Jun 20th, 2025 at 26.38
Smart Scan Analysis for UCIB
Based on our trend formula, UCIB is rated as a -60 on a scale from -100 (Strong Downtrend) to +100 (Strong Uptrend).
| Open | High | Low | Price | Change |
|---|---|---|---|---|
| 26.3000 | 26.4000 | 26.2301 | 26.2301 | -0.2055 |
| Prev. Close | Volume | Bid | Ask | Time |
| 26.6692 | 744 | 2025-06-30 14:56:04 |
| Year High | 16.2055 | Year High Date | 2018-05-23 |
| Year Low | 14.83 | Year Low Date | 2018-08-06 |
| 52wk High | 29.18 | 52wk High Date | 2024-10-07 |
| 52wk Low | 22 | 52wk Low Date | 2024-12-12 |
| Average Volume | 2,322 | Volatility | 72.27 |