Stock Trend Analysis Report
Prepared for you on Saturday, April 18, 2026.
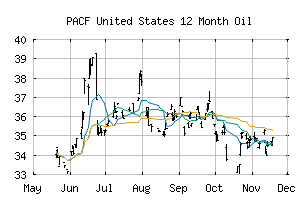
United States 12 Month Oil (PACF:USL)
Weak Uptrend (+65) - USL is showing signs of weakening momentum to the upside. Monitor USL as it may be in the beginning stages of a reversal.
Is it time to buy, sell, or avoid USL?
MarketClub looks at technical strength and momentum to determine if the timing is right for USL.
Learn more about the Trade Triangles and how we make technical analysis as easy as buy and sell.
|
|||||||||||||||
|
|||||||||||||||
MarketClub’s Trade Triangles for USL
![]() The long-term trend has been UP since Jan 14th, 2026 at 35.5816
The long-term trend has been UP since Jan 14th, 2026 at 35.5816
![]() The intermediate-term trend has been UP since Jan 9th, 2026 at 34.0400
The intermediate-term trend has been UP since Jan 9th, 2026 at 34.0400
![]() The short-term trend has been DOWN since Apr 17th, 2026 at 49.0300
The short-term trend has been DOWN since Apr 17th, 2026 at 49.0300
Smart Scan Analysis for USL
Based on our trend formula, USL is rated as a +65 on a scale from -100 (Strong Downtrend) to +100 (Strong Uptrend).
| Open | High | Low | Price | Change |
|---|---|---|---|---|
| 46.95 | 47.37 | 45.80 | 47.27 | -2.43 |
| Prev. Close | Volume | Bid | Ask | Time |
| 47.16 | 66051 | 2026-04-17 15:58:07 |
| Year High | 28.54 | Year High Date | 2018-10-03 |
| Year Low | 19.35 | Year Low Date | 2018-11-28 |
| 52wk High | 51.05 | 52wk High Date | 2026-03-19 |
| 52wk Low | 31.48 | 52wk Low Date | 2025-05-05 |
| Year End Close | 39.67 | Average Volume | 71,372 |
| Shares Outstanding | 1,200 | Assets | 64,979,545M |
| Liabilities | 108,261M | Beta | 1.06 |
| Volatility | 36.91 |