Stock Trend Analysis Report
Prepared for you on Sunday, August 31, 2025.
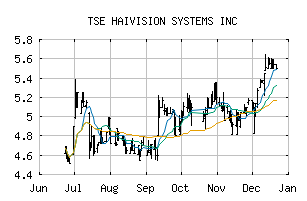
HAIVISION SYSTEMS INC (TSE:HAI)
Weak Uptrend (+65) - HAI is showing signs of weakening momentum to the upside. Monitor HAI as it may be in the beginning stages of a reversal.
Is it time to buy, sell, or avoid HAI?
MarketClub looks at technical strength and momentum to determine if the timing is right for HAI.
Learn more about the Trade Triangles and how we make technical analysis as easy as buy and sell.
|
|||||||||||||||
|
|||||||||||||||
MarketClub’s Trade Triangles for HAI
![]() The long-term trend has been UP since Jun 9th, 2025 at 4.735
The long-term trend has been UP since Jun 9th, 2025 at 4.735
![]() The intermediate-term trend has been DOWN since Aug 14th, 2025 at 4.630
The intermediate-term trend has been DOWN since Aug 14th, 2025 at 4.630
![]() The short-term trend has been UP since Aug 28th, 2025 at 4.700
The short-term trend has been UP since Aug 28th, 2025 at 4.700
Smart Scan Analysis for HAI
Based on our trend formula, HAI is rated as a +65 on a scale from -100 (Strong Downtrend) to +100 (Strong Uptrend).
| Open | High | Low | Price | Change |
|---|---|---|---|---|
| 4.70 | 4.79 | 4.70 | 4.79 | +0.06 |
| Prev. Close | Volume | Bid | Ask | Time |
| 4.68 | 5570 | 2025-08-29 14:41:51 |