Stock Trend Analysis Report
Prepared for you on Wednesday, March 25, 2026.
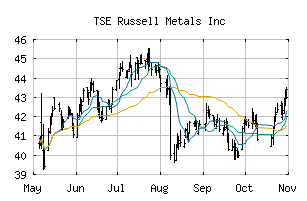
Russell Metals Inc (TSE:RUS)
Weak Uptrend (+65) - RUS is showing signs of weakening momentum to the upside. Monitor RUS as it may be in the beginning stages of a reversal.
Is it time to buy, sell, or avoid RUS?
MarketClub looks at technical strength and momentum to determine if the timing is right for RUS.
Learn more about the Trade Triangles and how we make technical analysis as easy as buy and sell.
|
|||||||||||||||
|
|||||||||||||||
MarketClub’s Trade Triangles for RUS
![]() The long-term trend has been UP since Dec 15th, 2025 at 43.50
The long-term trend has been UP since Dec 15th, 2025 at 43.50
![]() The intermediate-term trend has been DOWN since Feb 12th, 2026 at 46.73
The intermediate-term trend has been DOWN since Feb 12th, 2026 at 46.73
![]() The short-term trend has been UP since Mar 23rd, 2026 at 47.78
The short-term trend has been UP since Mar 23rd, 2026 at 47.78
Smart Scan Analysis for RUS
Based on our trend formula, RUS is rated as a +65 on a scale from -100 (Strong Downtrend) to +100 (Strong Uptrend).
| Open | High | Low | Price | Change |
|---|---|---|---|---|
| 48.31 | 48.35 | 47.85 | 48.11 | +0.38 |
| Prev. Close | Volume | Bid | Ask | Time |
| 47.73 | 198245 | 2026-03-25 16:00:01 |
| Year High | 32.65 | Year High Date | 2018-02-20 |
| Year Low | 22.48 | Year Low Date | 2018-11-27 |
| 52wk High | 32.65 | 52wk High Date | 2018-02-20 |
| 52wk Low | 22.48 | 52wk Low Date | 2018-11-27 |
| Year End Close | 27.61 | Average Volume | 227,670 |
| Volatility | 27.93 | Payment Date | 2019-09-16 |