Stock Trend Analysis Report
Prepared for you on Wednesday, March 25, 2026.
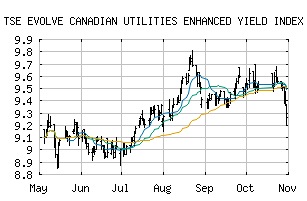
EVOLVE CANADIAN UTILITIES ENHANCED YIELD INDEX FD (TSE:UTES)
Sidelines Mode (-50) - UTES is failing to move into a strong trend and is encountering choppy trading conditions. Be cautious and consider taking a sidelines position until UTES can gain momentum.
Is it time to buy, sell, or avoid UTES?
MarketClub looks at technical strength and momentum to determine if the timing is right for UTES.
Learn more about the Trade Triangles and how we make technical analysis as easy as buy and sell.
|
|||||||||||||||
|
|||||||||||||||
MarketClub’s Trade Triangles for UTES
![]() The long-term trend has been UP since Feb 13th, 2026 at 9.55
The long-term trend has been UP since Feb 13th, 2026 at 9.55
![]() The intermediate-term trend has been DOWN since Mar 23rd, 2026 at 9.59
The intermediate-term trend has been DOWN since Mar 23rd, 2026 at 9.59
![]() The short-term trend has been DOWN since Mar 20th, 2026 at 9.72
The short-term trend has been DOWN since Mar 20th, 2026 at 9.72
Smart Scan Analysis for UTES
Based on our trend formula, UTES is rated as a -50 on a scale from -100 (Strong Downtrend) to +100 (Strong Uptrend).
| Open | High | Low | Price | Change |
|---|---|---|---|---|
| 9.760 | 9.800 | 9.730 | 9.765 | +0.065 |
| Prev. Close | Volume | Bid | Ask | Time |
| 9.700 | 109320 | 2026-03-25 15:59:30 |