Stock Trend Analysis Report
Prepared for you on Tuesday, April 14, 2026.
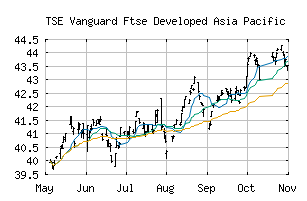
Vanguard Ftse Developed Asia Pacific (TSE:VE)
Bull Market Weakness (+75) - VE is showing signs of short-term weakness, but still remains in the confines of a long-term uptrend. Keep an eye on VE as it may be in the beginning stages of a reversal.
Is it time to buy, sell, or avoid VE?
MarketClub looks at technical strength and momentum to determine if the timing is right for VE.
Learn more about the Trade Triangles and how we make technical analysis as easy as buy and sell.
|
|||||||||||||||
|
|||||||||||||||
MarketClub’s Trade Triangles for VE
![]() The long-term trend has been DOWN since Mar 9th, 2026 at 43.745
The long-term trend has been DOWN since Mar 9th, 2026 at 43.745
![]() The intermediate-term trend has been UP since Apr 1st, 2026 at 45.190
The intermediate-term trend has been UP since Apr 1st, 2026 at 45.190
![]() The short-term trend has been UP since Mar 25th, 2026 at 43.670
The short-term trend has been UP since Mar 25th, 2026 at 43.670
Smart Scan Analysis for VE
Based on our trend formula, VE is rated as a +70 on a scale from -100 (Strong Downtrend) to +100 (Strong Uptrend).
| Open | High | Low | Price | Change |
|---|---|---|---|---|
| 47.07 | 47.35 | 47.07 | 47.30 | +0.37 |
| Prev. Close | Volume | Bid | Ask | Time |
| 46.93 | 6355 | 2026-04-14 15:53:43 |
| Year High | 31 | Year High Date | 2018-01-26 |
| Year Low | 26 | Year Low Date | 2018-10-24 |
| 52wk High | 31 | 52wk High Date | 2018-01-26 |
| 52wk Low | 26 | 52wk Low Date | 2018-10-24 |
| Average Volume | 2,637 | Volatility | 16.92 |