Stock Trend Analysis Report
Prepared for you on Thursday, November 21, 2024.
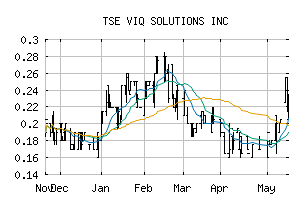
VIQ SOLUTIONS INC (TSE:VQS)
Crossroads (-60) - VQS is struggling to move into a solid trend. Beware of choppy markets and consider a sidelines position until a stronger trend is identified.
Is it time to buy, sell, or avoid VQS?
MarketClub looks at technical strength and momentum to determine if the timing is right for VQS.
Learn more about the Trade Triangles and how we make technical analysis as easy as buy and sell.
|
|||||||||||||||
|
|||||||||||||||
MarketClub’s Trade Triangles for VQS
![]() The long-term trend has been UP since Oct 22nd, 2024 at 0.250
The long-term trend has been UP since Oct 22nd, 2024 at 0.250
![]() The intermediate-term trend has been DOWN since Nov 11th, 2024 at 0.225
The intermediate-term trend has been DOWN since Nov 11th, 2024 at 0.225
![]() The short-term trend has been DOWN since Oct 30th, 2024 at 0.250
The short-term trend has been DOWN since Oct 30th, 2024 at 0.250
Smart Scan Analysis for VQS
Based on our trend formula, VQS is rated as a -60 on a scale from -100 (Strong Downtrend) to +100 (Strong Uptrend).
| Open | High | Low | Price | Change |
|---|---|---|---|---|
| 0.19 | 0.19 | 0.18 | 0.18 | -0.02 |
| Prev. Close | Volume | Bid | Ask | Time |
| 0.18 | 17650 | 2024-11-20 15:58:28 |