Forex Trend Analysis Report
Prepared for you on Tuesday, April 14, 2026.
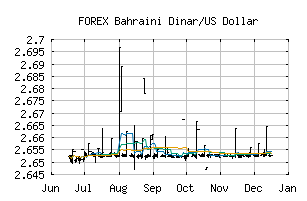
Bahraini Dinar/US Dollar (FOREX:BHDUSD)
Crossroads (+60) - BHDUSD is struggling to move into a solid trend. Beware of choppy markets and consider a sidelines position until a stronger trend is identified.
Is it time to buy, sell, or avoid BHDUSD?
MarketClub looks at technical strength and momentum to determine if the timing is right for BHDUSD.
Learn more about the Trade Triangles and how we make technical analysis as easy as buy and sell.
|
|||||||||||||||
|
|||||||||||||||
MarketClub’s Trade Triangles for BHDUSD
![]() The long-term trend has been DOWN since Jan 30th, 2026 at 2.6459643
The long-term trend has been DOWN since Jan 30th, 2026 at 2.6459643
![]() The intermediate-term trend has been UP since Apr 12th, 2026 at 2.6573247
The intermediate-term trend has been UP since Apr 12th, 2026 at 2.6573247
![]() The short-term trend has been UP since Apr 8th, 2026 at 2.6492466
The short-term trend has been UP since Apr 8th, 2026 at 2.6492466
Smart Scan Analysis for BHDUSD
Based on our trend formula, BHDUSD is rated as a +60 on a scale from -100 (Strong Downtrend) to +100 (Strong Uptrend).
| Open | High | Low | Price | Change |
|---|---|---|---|---|
| 2.6506617 | 2.6519183 | 2.6494577 | 2.6519183 | +0.0012570 |
| Prev. Close | Volume | Bid | Ask | Time |
| 2.6506617 | 2026-04-14 19:34:55 |