Forex Trend Analysis Report
Prepared for you on Wednesday, April 8, 2026.
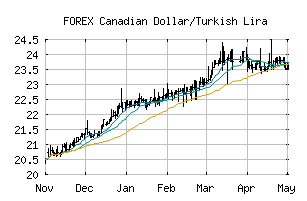
Canadian Dollar/Turkish Lira (FOREX:CADTRY)
Weak Uptrend (+65) - CADTRY is showing signs of weakening momentum to the upside. Monitor CADTRY as it may be in the beginning stages of a reversal.
Is it time to buy, sell, or avoid CADTRY?
MarketClub looks at technical strength and momentum to determine if the timing is right for CADTRY.
Learn more about the Trade Triangles and how we make technical analysis as easy as buy and sell.
|
|||||||||||||||
|
|||||||||||||||
MarketClub’s Trade Triangles for CADTRY
![]() The long-term trend has been UP since Feb 3rd, 2025 at 25.003443
The long-term trend has been UP since Feb 3rd, 2025 at 25.003443
![]() The intermediate-term trend has been DOWN since Mar 22nd, 2026 at 31.979980
The intermediate-term trend has been DOWN since Mar 22nd, 2026 at 31.979980
![]() The short-term trend has been UP since Apr 1st, 2026 at 32.104940
The short-term trend has been UP since Apr 1st, 2026 at 32.104940
Smart Scan Analysis for CADTRY
Based on our trend formula, CADTRY is rated as a +65 on a scale from -100 (Strong Downtrend) to +100 (Strong Uptrend).
| Open | High | Low | Price | Change |
|---|---|---|---|---|
| 32.186015 | 32.261130 | 32.068410 | 32.129800 | -0.056215 |
| Prev. Close | Volume | Bid | Ask | Time |
| 32.186015 | 2026-04-08 11:31:57 |