Forex Trend Analysis Report
Prepared for you on Tuesday, April 14, 2026.
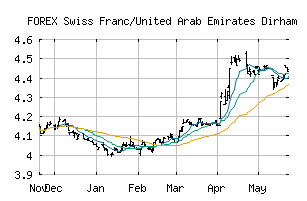
Swiss Franc/United Arab Emirates Dirham (FOREX:CHFAED)
Countertrend Up (+85) - CHFAED is showing short-term weakness. However, look for the longer-term bullish trend to resume. As always, continue to monitor the trend score and utilize a stop order.
Is it time to buy, sell, or avoid CHFAED?
MarketClub looks at technical strength and momentum to determine if the timing is right for CHFAED.
Learn more about the Trade Triangles and how we make technical analysis as easy as buy and sell.
|
|||||||||||||||
|
|||||||||||||||
MarketClub’s Trade Triangles for CHFAED
![]() The long-term trend has been UP since Apr 3rd, 2025 at 4.1905360
The long-term trend has been UP since Apr 3rd, 2025 at 4.1905360
![]() The intermediate-term trend has been UP since Apr 10th, 2026 at 4.6471745
The intermediate-term trend has been UP since Apr 10th, 2026 at 4.6471745
![]() The short-term trend has been UP since Apr 10th, 2026 at 4.5977544
The short-term trend has been UP since Apr 10th, 2026 at 4.5977544
Smart Scan Analysis for CHFAED
Based on our trend formula, CHFAED is rated as a +80 on a scale from -100 (Strong Downtrend) to +100 (Strong Uptrend).
| Open | High | Low | Price | Change |
|---|---|---|---|---|
| 4.6533089 | 4.6533089 | 4.6533089 | 4.6533089 | 0.0000000 |
| Prev. Close | Volume | Bid | Ask | Time |
| 4.7023047 | 2026-04-12 07:24:50 |