Forex Trend Analysis Report
Prepared for you on Tuesday, April 14, 2026.
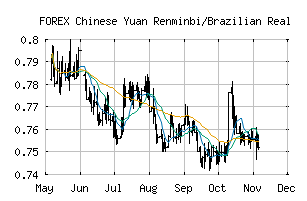
Chinese Yuan Renminbi/Brazilian Real (FOREX:CNYBRL)
Countertrend Down (-85) - CNYBRL is showing short-term strength. However, look for the longer-term bearish trend to resume. As always, continue to monitor the trend score and set stops.
Is it time to buy, sell, or avoid CNYBRL?
MarketClub looks at technical strength and momentum to determine if the timing is right for CNYBRL.
Learn more about the Trade Triangles and how we make technical analysis as easy as buy and sell.
|
|||||||||||||||
|
|||||||||||||||
MarketClub’s Trade Triangles for CNYBRL
![]() The long-term trend has been DOWN since Feb 4th, 2026 at 0.7396150
The long-term trend has been DOWN since Feb 4th, 2026 at 0.7396150
![]() The intermediate-term trend has been DOWN since Apr 7th, 2026 at 0.7464079
The intermediate-term trend has been DOWN since Apr 7th, 2026 at 0.7464079
![]() The short-term trend has been UP since Apr 8th, 2026 at 0.7539301
The short-term trend has been UP since Apr 8th, 2026 at 0.7539301
Smart Scan Analysis for CNYBRL
Based on our trend formula, CNYBRL is rated as a -85 on a scale from -100 (Strong Downtrend) to +100 (Strong Uptrend).
| Open | High | Low | Price | Change |
|---|---|---|---|---|
| 0.7314359 | 0.7351032 | 0.7279222 | 0.7344283 | +0.0029920 |
| Prev. Close | Volume | Bid | Ask | Time |
| 0.7314359 | 2026-04-14 17:41:32 |