Forex Trend Analysis Report
Prepared for you on Tuesday, April 7, 2026.
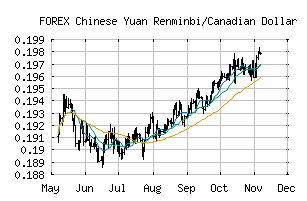
Chinese Yuan Renminbi/Canadian Dollar (FOREX:CNYCAD)
Bull Market Weakness (+75) - CNYCAD is showing signs of short-term weakness, but still remains in the confines of a long-term uptrend. Keep an eye on CNYCAD as it may be in the beginning stages of a reversal.
Is it time to buy, sell, or avoid CNYCAD?
MarketClub looks at technical strength and momentum to determine if the timing is right for CNYCAD.
Learn more about the Trade Triangles and how we make technical analysis as easy as buy and sell.
|
|||||||||||||||
|
|||||||||||||||
MarketClub’s Trade Triangles for CNYCAD
![]() The long-term trend has been UP since Feb 26th, 2026 at 0.19994667
The long-term trend has been UP since Feb 26th, 2026 at 0.19994667
![]() The intermediate-term trend has been UP since Mar 25th, 2026 at 0.20002408
The intermediate-term trend has been UP since Mar 25th, 2026 at 0.20002408
![]() The short-term trend has been DOWN since Apr 7th, 2026 at 0.20199077
The short-term trend has been DOWN since Apr 7th, 2026 at 0.20199077
Smart Scan Analysis for CNYCAD
Based on our trend formula, CNYCAD is rated as a +75 on a scale from -100 (Strong Downtrend) to +100 (Strong Uptrend).
| Open | High | Low | Price | Change |
|---|---|---|---|---|
| 0.20222451 | 0.20282247 | 0.20189678 | 0.20219615 | -0.00002800 |
| Prev. Close | Volume | Bid | Ask | Time |
| 0.20222451 | 2026-04-07 18:58:55 |