Forex Trend Analysis Report
Prepared for you on Wednesday, April 8, 2026.
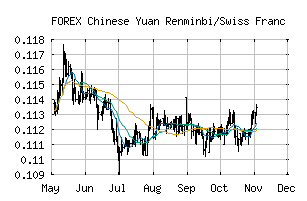
Chinese Yuan Renminbi/Swiss Franc (FOREX:CNYCHF)
Strong Uptrend (+100) - CNYCHF is in a strong uptrend that is likely to continue. With short-term, intermediate, and long-term bullish momentum, CNYCHF continues to climb. Traders should protect gains and look for a change in score to suggest a slow down in momentum.
Is it time to buy, sell, or avoid CNYCHF?
MarketClub looks at technical strength and momentum to determine if the timing is right for CNYCHF.
Learn more about the Trade Triangles and how we make technical analysis as easy as buy and sell.
|
|||||||||||||||
|
|||||||||||||||
MarketClub’s Trade Triangles for CNYCHF
![]() The long-term trend has been UP since Mar 18th, 2026 at 0.11542181
The long-term trend has been UP since Mar 18th, 2026 at 0.11542181
![]() The intermediate-term trend has been UP since Feb 24th, 2026 at 0.11247864
The intermediate-term trend has been UP since Feb 24th, 2026 at 0.11247864
![]() The short-term trend has been UP since Apr 7th, 2026 at 0.11651054
The short-term trend has been UP since Apr 7th, 2026 at 0.11651054
Smart Scan Analysis for CNYCHF
Based on our trend formula, CNYCHF is rated as a +100 on a scale from -100 (Strong Downtrend) to +100 (Strong Uptrend).
| Open | High | Low | Price | Change |
|---|---|---|---|---|
| 0.11523082 | 0.11604412 | 0.11476179 | 0.11588901 | +0.00065800 |
| Prev. Close | Volume | Bid | Ask | Time |
| 0.11523082 | 2026-04-08 15:45:01 |