Forex Trend Analysis Report
Prepared for you on Tuesday, March 31, 2026.
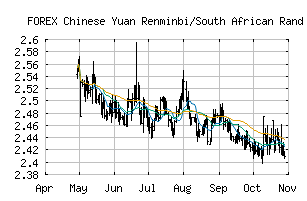
Chinese Yuan Renminbi/South African Rand (FOREX:CNYZAR)
Strong Uptrend (+100) - CNYZAR is in a strong uptrend that is likely to continue. With short-term, intermediate, and long-term bullish momentum, CNYZAR continues to climb. Traders should protect gains and look for a change in score to suggest a slow down in momentum.
Is it time to buy, sell, or avoid CNYZAR?
MarketClub looks at technical strength and momentum to determine if the timing is right for CNYZAR.
Learn more about the Trade Triangles and how we make technical analysis as easy as buy and sell.
|
|||||||||||||||
|
|||||||||||||||
MarketClub’s Trade Triangles for CNYZAR
![]() The long-term trend has been UP since Mar 3rd, 2026 at 2.4262329
The long-term trend has been UP since Mar 3rd, 2026 at 2.4262329
![]() The intermediate-term trend has been UP since Mar 1st, 2026 at 2.3481653
The intermediate-term trend has been UP since Mar 1st, 2026 at 2.3481653
![]() The short-term trend has been UP since Mar 18th, 2026 at 2.4614612
The short-term trend has been UP since Mar 18th, 2026 at 2.4614612
Smart Scan Analysis for CNYZAR
Based on our trend formula, CNYZAR is rated as a +100 on a scale from -100 (Strong Downtrend) to +100 (Strong Uptrend).
| Open | High | Low | Price | Change |
|---|---|---|---|---|
| 2.4829170 | 2.4840455 | 2.4827434 | 2.4838068 | +0.0008900 |
| Prev. Close | Volume | Bid | Ask | Time |
| 2.4829170 | 2026-03-31 00:14:03 |