Forex Trend Analysis Report
Prepared for you on Tuesday, April 14, 2026.
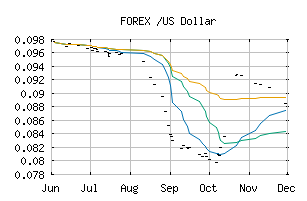
/US Dollar (FOREX:GHSUSD)
Weak Downtrend (-65) - GHSUSD is showing signs of a strengthening downtrend. Monitor GHSUSD as it may be building momentum to the downside.
Is it time to buy, sell, or avoid GHSUSD?
MarketClub looks at technical strength and momentum to determine if the timing is right for GHSUSD.
Learn more about the Trade Triangles and how we make technical analysis as easy as buy and sell.
|
|||||||||||||||
|
|||||||||||||||
MarketClub’s Trade Triangles for GHSUSD
![]() The long-term trend has been UP since Jan 4th, 2026 at 0.09282463
The long-term trend has been UP since Jan 4th, 2026 at 0.09282463
![]() The intermediate-term trend has been DOWN since Mar 26th, 2026 at 0.09195189
The intermediate-term trend has been DOWN since Mar 26th, 2026 at 0.09195189
![]() The short-term trend has been DOWN since Mar 12th, 2026 at 0.09386549
The short-term trend has been DOWN since Mar 12th, 2026 at 0.09386549
Smart Scan Analysis for GHSUSD
Based on our trend formula, GHSUSD is rated as a -70 on a scale from -100 (Strong Downtrend) to +100 (Strong Uptrend).
| Open | High | Low | Price | Change |
|---|---|---|---|---|
| 0.091005 | 0.091005 | 0.091005 | 0.091005 | 0.000000 |
| Prev. Close | Volume | Bid | Ask | Time |
| 0.090527 | 2026-04-11 05:21:17 |