Forex Trend Analysis Report
Prepared for you on Tuesday, April 14, 2026.
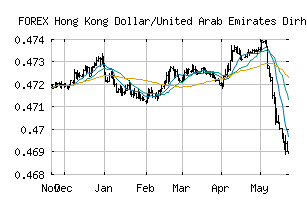
Hong Kong Dollar/United Arab Emirates Dirham (FOREX:HKDAED)
Weak Downtrend (-65) - HKDAED is showing signs of a strengthening downtrend. Monitor HKDAED as it may be building momentum to the downside.
Is it time to buy, sell, or avoid HKDAED?
MarketClub looks at technical strength and momentum to determine if the timing is right for HKDAED.
Learn more about the Trade Triangles and how we make technical analysis as easy as buy and sell.
|
|||||||||||||||
|
|||||||||||||||
MarketClub’s Trade Triangles for HKDAED
![]() The long-term trend has been DOWN since Jan 2nd, 2026 at 0.47127540
The long-term trend has been DOWN since Jan 2nd, 2026 at 0.47127540
![]() The intermediate-term trend has been DOWN since Mar 10th, 2026 at 0.46929409
The intermediate-term trend has been DOWN since Mar 10th, 2026 at 0.46929409
![]() The short-term trend has been UP since Apr 7th, 2026 at 0.46871598
The short-term trend has been UP since Apr 7th, 2026 at 0.46871598
Smart Scan Analysis for HKDAED
Based on our trend formula, HKDAED is rated as a -65 on a scale from -100 (Strong Downtrend) to +100 (Strong Uptrend).
| Open | High | Low | Price | Change |
|---|---|---|---|---|
| 0.46891765 | 0.46895281 | 0.46874321 | 0.46890689 | -0.00001100 |
| Prev. Close | Volume | Bid | Ask | Time |
| 0.46891765 | 2026-04-14 17:45:20 |