Forex Trend Analysis Report
Prepared for you on Tuesday, April 14, 2026.
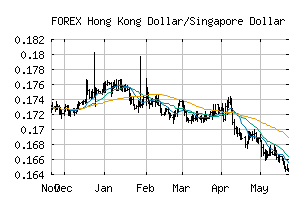
Hong Kong Dollar/Singapore Dollar (FOREX:HKDSGD)
Bear Market Rally (-75) - HKDSGD is showing some rallying power, but still remains in the confines of a long-term downtrend. Keep an eye on HKDSGD as it may be in the beginning of a reversal.
Is it time to buy, sell, or avoid HKDSGD?
MarketClub looks at technical strength and momentum to determine if the timing is right for HKDSGD.
Learn more about the Trade Triangles and how we make technical analysis as easy as buy and sell.
|
|||||||||||||||
|
|||||||||||||||
MarketClub’s Trade Triangles for HKDSGD
![]() The long-term trend has been DOWN since Jan 1st, 2026 at 0.16468714
The long-term trend has been DOWN since Jan 1st, 2026 at 0.16468714
![]() The intermediate-term trend has been DOWN since Apr 8th, 2026 at 0.16248345
The intermediate-term trend has been DOWN since Apr 8th, 2026 at 0.16248345
![]() The short-term trend has been UP since Apr 12th, 2026 at 0.16297453
The short-term trend has been UP since Apr 12th, 2026 at 0.16297453
Smart Scan Analysis for HKDSGD
Based on our trend formula, HKDSGD is rated as a -75 on a scale from -100 (Strong Downtrend) to +100 (Strong Uptrend).
| Open | High | Low | Price | Change |
|---|---|---|---|---|
| 0.16257825 | 0.16270000 | 0.16108900 | 0.16228944 | -0.00028900 |
| Prev. Close | Volume | Bid | Ask | Time |
| 0.16257825 | 2026-04-14 17:41:57 |