Forex Trend Analysis Report
Prepared for you on Thursday, April 16, 2026.
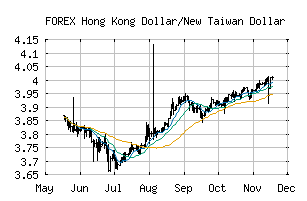
Hong Kong Dollar/New Taiwan Dollar (FOREX:HKDTWD)
Crossroads (-60) - HKDTWD is struggling to move into a solid trend. Beware of choppy markets and consider a sidelines position until a stronger trend is identified.
Is it time to buy, sell, or avoid HKDTWD?
MarketClub looks at technical strength and momentum to determine if the timing is right for HKDTWD.
Learn more about the Trade Triangles and how we make technical analysis as easy as buy and sell.
|
|||||||||||||||
|
|||||||||||||||
MarketClub’s Trade Triangles for HKDTWD
![]() The long-term trend has been UP since Dec 12th, 2025 at 4.0504260
The long-term trend has been UP since Dec 12th, 2025 at 4.0504260
![]() The intermediate-term trend has been DOWN since Apr 7th, 2026 at 4.0548667
The intermediate-term trend has been DOWN since Apr 7th, 2026 at 4.0548667
![]() The short-term trend has been DOWN since Mar 31st, 2026 at 4.0740868
The short-term trend has been DOWN since Mar 31st, 2026 at 4.0740868
Smart Scan Analysis for HKDTWD
Based on our trend formula, HKDTWD is rated as a -60 on a scale from -100 (Strong Downtrend) to +100 (Strong Uptrend).
| Open | High | Low | Price | Change |
|---|---|---|---|---|
| 4.0248980 | 4.0406506 | 4.0245563 | 4.0355114 | +0.0106130 |
| Prev. Close | Volume | Bid | Ask | Time |
| 4.0248980 | 2026-04-16 13:26:30 |