Forex Trend Analysis Report
Prepared for you on Friday, April 3, 2026.
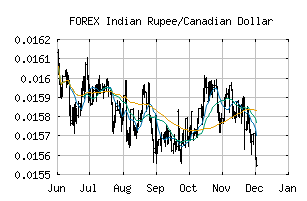
Indian Rupee/Canadian Dollar (FOREX:INRCAD)
Bull Market Weakness (+75) - INRCAD is showing signs of short-term weakness, but still remains in the confines of a long-term uptrend. Keep an eye on INRCAD as it may be in the beginning stages of a reversal.
Is it time to buy, sell, or avoid INRCAD?
MarketClub looks at technical strength and momentum to determine if the timing is right for INRCAD.
Learn more about the Trade Triangles and how we make technical analysis as easy as buy and sell.
|
|||||||||||||||
|
|||||||||||||||
MarketClub’s Trade Triangles for INRCAD
![]() The long-term trend has been DOWN since Dec 2nd, 2025 at 0.01555717
The long-term trend has been DOWN since Dec 2nd, 2025 at 0.01555717
![]() The intermediate-term trend has been UP since Mar 31st, 2026 at 0.01487127
The intermediate-term trend has been UP since Mar 31st, 2026 at 0.01487127
![]() The short-term trend has been UP since Mar 30th, 2026 at 0.01472050
The short-term trend has been UP since Mar 30th, 2026 at 0.01472050
Smart Scan Analysis for INRCAD
Based on our trend formula, INRCAD is rated as a +70 on a scale from -100 (Strong Downtrend) to +100 (Strong Uptrend).
| Open | High | Low | Price | Change |
|---|---|---|---|---|
| 0.01496915 | 0.01497325 | 0.01496384 | 0.01497115 | +0.00000200 |
| Prev. Close | Volume | Bid | Ask | Time |
| 0.01496915 | 2026-04-03 02:24:11 |