Forex Trend Analysis Report
Prepared for you on Saturday, March 28, 2026.
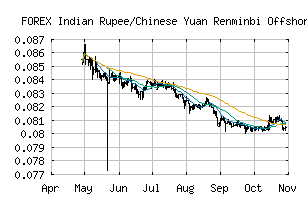
Indian Rupee/Chinese Yuan Renminbi Offshore (FOREX:INRCNH)
Strong Downtrend (-100) - INRCNH is in a strong downtrend that is likely to continue. With short-term, intermediate, and long-term bearish momentum, INRCNH continues to fall. Traders should use caution and set stops.
Is it time to buy, sell, or avoid INRCNH?
MarketClub looks at technical strength and momentum to determine if the timing is right for INRCNH.
Learn more about the Trade Triangles and how we make technical analysis as easy as buy and sell.
|
|||||||||||||||
|
|||||||||||||||
MarketClub’s Trade Triangles for INRCNH
![]() The long-term trend has been DOWN since May 22nd, 2025 at 0.08263732
The long-term trend has been DOWN since May 22nd, 2025 at 0.08263732
![]() The intermediate-term trend has been DOWN since Oct 29th, 2025 at 0.08020218
The intermediate-term trend has been DOWN since Oct 29th, 2025 at 0.08020218
![]() The short-term trend has been DOWN since Mar 27th, 2026 at 0.07292676
The short-term trend has been DOWN since Mar 27th, 2026 at 0.07292676
Smart Scan Analysis for INRCNH
Based on our trend formula, INRCNH is rated as a -100 on a scale from -100 (Strong Downtrend) to +100 (Strong Uptrend).
| Open | High | Low | Price | Change |
|---|---|---|---|---|
| 0.07282462 | 0.07282462 | 0.07282462 | 0.07282462 | 0.00000000 |
| Prev. Close | Volume | Bid | Ask | Time |
| 0.07282462 | 2026-03-28 15:15:26 |