Forex Trend Analysis Report
Prepared for you on Wednesday, March 25, 2026.
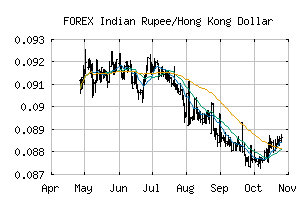
Indian Rupee/Hong Kong Dollar (FOREX:INRHKD)
Strong Downtrend (-100) - INRHKD is in a strong downtrend that is likely to continue. With short-term, intermediate, and long-term bearish momentum, INRHKD continues to fall. Traders should use caution and set stops.
Is it time to buy, sell, or avoid INRHKD?
MarketClub looks at technical strength and momentum to determine if the timing is right for INRHKD.
Learn more about the Trade Triangles and how we make technical analysis as easy as buy and sell.
|
|||||||||||||||
|
|||||||||||||||
MarketClub’s Trade Triangles for INRHKD
![]() The long-term trend has been DOWN since Jul 30th, 2025 at 0.08935170
The long-term trend has been DOWN since Jul 30th, 2025 at 0.08935170
![]() The intermediate-term trend has been DOWN since Mar 2nd, 2026 at 0.08566827
The intermediate-term trend has been DOWN since Mar 2nd, 2026 at 0.08566827
![]() The short-term trend has been DOWN since Mar 20th, 2026 at 0.08389598
The short-term trend has been DOWN since Mar 20th, 2026 at 0.08389598
Smart Scan Analysis for INRHKD
Based on our trend formula, INRHKD is rated as a -100 on a scale from -100 (Strong Downtrend) to +100 (Strong Uptrend).
| Open | High | Low | Price | Change |
|---|---|---|---|---|
| 0.08334861 | 0.08338554 | 0.08299079 | 0.08325318 | -0.00009500 |
| Prev. Close | Volume | Bid | Ask | Time |
| 0.08334861 | 2026-03-25 17:04:25 |