Forex Trend Analysis Report
Prepared for you on Friday, March 27, 2026.
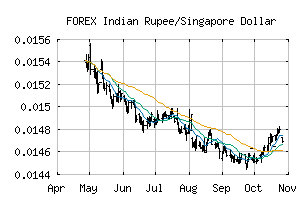
Indian Rupee/Singapore Dollar (FOREX:INRSGD)
Long-Term Downtrend (-90) - INRSGD is in a strong downtrend that is likely to continue. While INRSGD is showing intraday strength, it remains in the confines of a bearish trend. Traders should use caution and set stops.
Is it time to buy, sell, or avoid INRSGD?
MarketClub looks at technical strength and momentum to determine if the timing is right for INRSGD.
Learn more about the Trade Triangles and how we make technical analysis as easy as buy and sell.
|
|||||||||||||||
|
|||||||||||||||
MarketClub’s Trade Triangles for INRSGD
![]() The long-term trend has been DOWN since Feb 4th, 2025 at 0.01555175
The long-term trend has been DOWN since Feb 4th, 2025 at 0.01555175
![]() The intermediate-term trend has been DOWN since Nov 21st, 2025 at 0.01457403
The intermediate-term trend has been DOWN since Nov 21st, 2025 at 0.01457403
![]() The short-term trend has been DOWN since Mar 17th, 2026 at 0.01383345
The short-term trend has been DOWN since Mar 17th, 2026 at 0.01383345
Smart Scan Analysis for INRSGD
Based on our trend formula, INRSGD is rated as a -90 on a scale from -100 (Strong Downtrend) to +100 (Strong Uptrend).
| Open | High | Low | Price | Change |
|---|---|---|---|---|
| 0.01363709 | 0.01363709 | 0.01356025 | 0.01360309 | -0.00003400 |
| Prev. Close | Volume | Bid | Ask | Time |
| 0.01363709 | 2026-03-27 13:29:58 |