Forex Trend Analysis Report
Prepared for you on Monday, April 6, 2026.
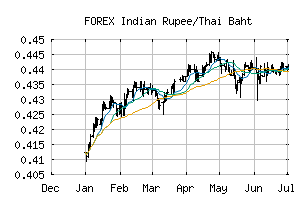
Indian Rupee/Thai Baht (FOREX:INRTHB)
Crossroads (+60) - INRTHB is struggling to move into a solid trend. Beware of choppy markets and consider a sidelines position until a stronger trend is identified.
Is it time to buy, sell, or avoid INRTHB?
MarketClub looks at technical strength and momentum to determine if the timing is right for INRTHB.
Learn more about the Trade Triangles and how we make technical analysis as easy as buy and sell.
|
|||||||||||||||
|
|||||||||||||||
MarketClub’s Trade Triangles for INRTHB
![]() The long-term trend has been DOWN since May 8th, 2025 at 0.38351636
The long-term trend has been DOWN since May 8th, 2025 at 0.38351636
![]() The intermediate-term trend has been UP since Mar 12th, 2026 at 0.34832000
The intermediate-term trend has been UP since Mar 12th, 2026 at 0.34832000
![]() The short-term trend has been UP since Mar 31st, 2026 at 0.34881633
The short-term trend has been UP since Mar 31st, 2026 at 0.34881633
Smart Scan Analysis for INRTHB
Based on our trend formula, INRTHB is rated as a +60 on a scale from -100 (Strong Downtrend) to +100 (Strong Uptrend).
| Open | High | Low | Price | Change |
|---|---|---|---|---|
| 0.35099541 | 0.35099541 | 0.35099541 | 0.35099541 | 0.00000000 |
| Prev. Close | Volume | Bid | Ask | Time |
| 0.35099541 | 2026-04-06 04:22:30 |