Forex Trend Analysis Report
Prepared for you on Wednesday, April 8, 2026.
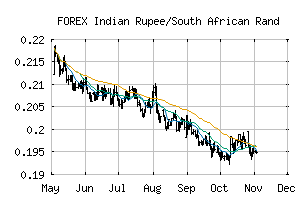
Indian Rupee/South African Rand (FOREX:INRZAR)
Strong Downtrend (-100) - INRZAR is in a strong downtrend that is likely to continue. With short-term, intermediate, and long-term bearish momentum, INRZAR continues to fall. Traders should use caution and set stops.
Is it time to buy, sell, or avoid INRZAR?
MarketClub looks at technical strength and momentum to determine if the timing is right for INRZAR.
Learn more about the Trade Triangles and how we make technical analysis as easy as buy and sell.
|
|||||||||||||||
|
|||||||||||||||
MarketClub’s Trade Triangles for INRZAR
![]() The long-term trend has been DOWN since Jun 4th, 2025 at 0.20759277
The long-term trend has been DOWN since Jun 4th, 2025 at 0.20759277
![]() The intermediate-term trend has been DOWN since Apr 7th, 2026 at 0.17777915
The intermediate-term trend has been DOWN since Apr 7th, 2026 at 0.17777915
![]() The short-term trend has been DOWN since Apr 6th, 2026 at 0.18069055
The short-term trend has been DOWN since Apr 6th, 2026 at 0.18069055
Smart Scan Analysis for INRZAR
Based on our trend formula, INRZAR is rated as a -100 on a scale from -100 (Strong Downtrend) to +100 (Strong Uptrend).
| Open | High | Low | Price | Change |
|---|---|---|---|---|
| 0.17798925 | 0.17818041 | 0.17733206 | 0.17737820 | -0.00061100 |
| Prev. Close | Volume | Bid | Ask | Time |
| 0.17798925 | 2026-04-08 01:36:44 |