Forex Trend Analysis Report
Prepared for you on Tuesday, April 7, 2026.
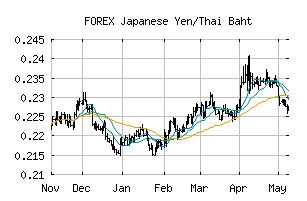
Japanese Yen/Thai Baht (FOREX:JPYTHB)
Sidelines Mode (+55) - JPYTHB is moving in a sideways pattern and is unable to gain momentum in either direction. Beware of choppy movement and consider a sidelines position until a stronger trend is identified.
Is it time to buy, sell, or avoid JPYTHB?
MarketClub looks at technical strength and momentum to determine if the timing is right for JPYTHB.
Learn more about the Trade Triangles and how we make technical analysis as easy as buy and sell.
|
|||||||||||||||
|
|||||||||||||||
MarketClub’s Trade Triangles for JPYTHB
![]() The long-term trend has been UP since Mar 19th, 2026 at 0.20732582
The long-term trend has been UP since Mar 19th, 2026 at 0.20732582
![]() The intermediate-term trend has been UP since Mar 16th, 2026 at 0.20327698
The intermediate-term trend has been UP since Mar 16th, 2026 at 0.20327698
![]() The short-term trend has been DOWN since Apr 3rd, 2026 at 0.20440873
The short-term trend has been DOWN since Apr 3rd, 2026 at 0.20440873
Smart Scan Analysis for JPYTHB
Based on our trend formula, JPYTHB is rated as a +55 on a scale from -100 (Strong Downtrend) to +100 (Strong Uptrend).
| Open | High | Low | Price | Change |
|---|---|---|---|---|
| 0.20427492 | 0.20434863 | 0.20203665 | 0.20262030 | -0.00165500 |
| Prev. Close | Volume | Bid | Ask | Time |
| 0.20427492 | 2026-04-07 22:20:32 |