Forex Trend Analysis Report
Prepared for you on Sunday, March 29, 2026.
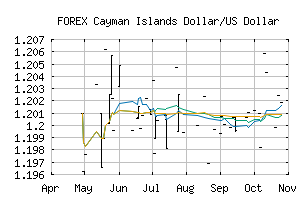
Cayman Islands Dollar/US Dollar (FOREX:KYDUSD)
Crossroads (-60) - KYDUSD is struggling to move into a solid trend. Beware of choppy markets and consider a sidelines position until a stronger trend is identified.
Is it time to buy, sell, or avoid KYDUSD?
MarketClub looks at technical strength and momentum to determine if the timing is right for KYDUSD.
Learn more about the Trade Triangles and how we make technical analysis as easy as buy and sell.
|
|||||||||||||||
|
|||||||||||||||
MarketClub’s Trade Triangles for KYDUSD
![]() The long-term trend has been DOWN since Feb 1st, 2026 at 1.1989377
The long-term trend has been DOWN since Feb 1st, 2026 at 1.1989377
![]() The intermediate-term trend has been UP since Mar 17th, 2026 at 1.2031825
The intermediate-term trend has been UP since Mar 17th, 2026 at 1.2031825
![]() The short-term trend has been UP since Mar 17th, 2026 at 1.2023989
The short-term trend has been UP since Mar 17th, 2026 at 1.2023989
Smart Scan Analysis for KYDUSD
Based on our trend formula, KYDUSD is rated as a -60 on a scale from -100 (Strong Downtrend) to +100 (Strong Uptrend).
| Open | High | Low | Price | Change |
|---|---|---|---|---|
| 1.2005065 | 1.2005065 | 1.2005065 | 1.2005065 | 0.0000000 |
| Prev. Close | Volume | Bid | Ask | Time |
| 1.2005065 | 2026-03-29 21:06:07 |